Free Server Monitoring: Why Zabbix Is Chosen By Many SysAdmins
For any System Administrator (SysAdmin) or DevOps engineer, server downtime is always a nightmare. If you don’t know how your system is performing, where RAM/CPU is overloaded, or when the hard drive is about to fill up… disaster can strike at any moment. System monitoring is the key. However, Enterprise solutions often cost thousands of dollars a year. That’s when Zabbix shines as a “$0” savior but with the power of the most expensive systems.
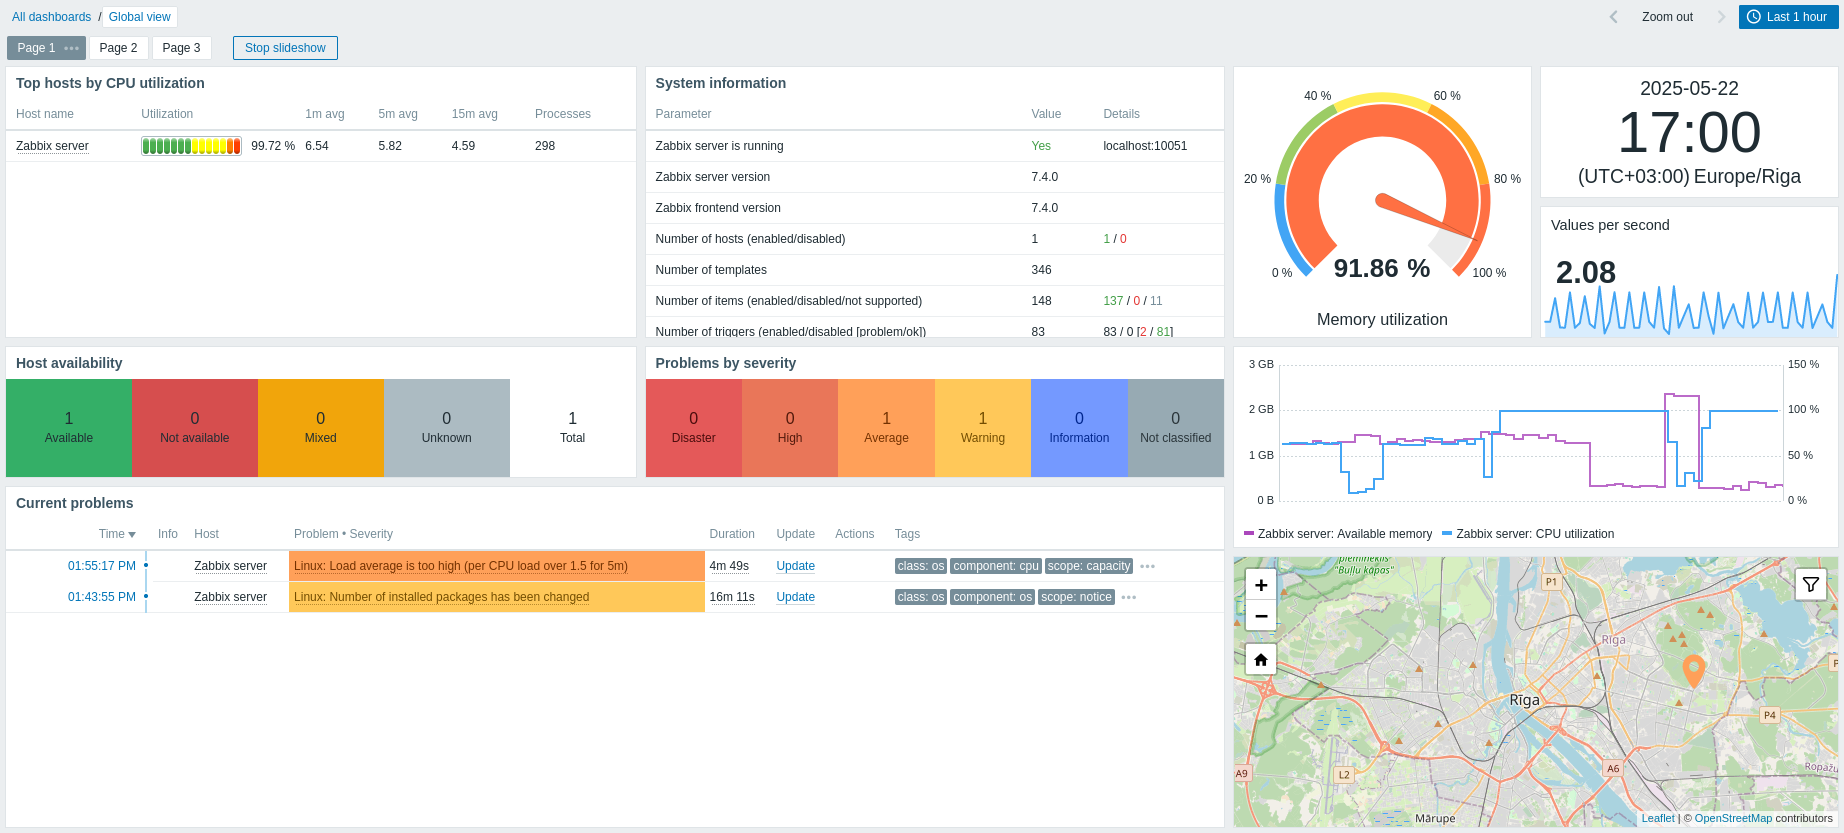
What is Zabbix?
Zabbix is an open-source, enterprise-class monitoring platform designed to track the performance and availability of servers, network devices, virtual machines, and cloud services in real-time.
Created by Alexei Vladishev and first released in 2001, Zabbix has become one of the most popular monitoring tools globally, serving everyone from small startups to multinational corporations, banks, and government organizations.
Why is Zabbix called a “$0 Solution”?
Unlike tools such as Datadog, SolarWinds, or PRTG that charge based on the number of devices (nodes) or sensors, Zabbix is 100% free. You can download the source code, install it, and monitor 10 servers or 100,000 servers without spending a dime on licensing fees. You only need to invest in a basic server (or VPS) to run the Zabbix Server.
5 Reasons Why SysAdmins “Go Crazy” for Zabbix
· “All-in-one” monitoring capability: Not only does it monitor basic parameters (CPU, RAM, Disk, Network) of Linux/Windows, but Zabbix can also dig deep into databases (MySQL, PostgreSQL, Oracle), monitor web applications, Docker, Kubernetes, network devices (Router/Switch via SNMP), and even IoT devices.
· Flexible & smart Alerting system: Zabbix allows setting up extremely detailed alert Triggers. When an issue occurs, the system not only sends Emails but also integrates messaging via Telegram, Slack, Microsoft Teams, or SMS. As a result, SysAdmins can react even while sleeping.
· Auto-discovery: In a large infrastructure with hundreds of newly added devices constantly, manual configuration is impossible. Zabbix has a network scanning feature that automatically recognizes devices and assigns appropriate monitoring Templates, saving dozens of working hours.
· Powerful Visualization: Zabbix provides intuitive Graphs, Dashboards, and Network Maps to easily observe the entire system. In particular, Zabbix integrates perfectly with Grafana to create “million-dollar” Dashboard screens.
· Huge community and built-in Templates: You don’t have to write monitoring scripts from scratch. The Zabbix Share community provides thousands of pre-made Templates for almost every device and application on the market. Just download and apply.
Conclusion
Zabbix proves that “Free doesn’t mean low quality”. The evidence is that it has stood at the top of monitoring tools for many years. If you are looking to build a powerful, stable infrastructure monitoring system while optimizing costs ($0 for licensing), Zabbix is definitely the first name you should explore.
In the upcoming articles, we will get our hands on installing Zabbix Server on CentOS/Ubuntu and how to configure it to add child servers (Zabbix Agents) to the system. Stay tuned!